Archives for posts with tag: note taking
In an ideal world, we’d have one person moderating a user research session and at least one other person taking notes or logging data. In practice it often just doesn’t work out that way. The more people I talk to who are doing user research, the more often I hear from experienced people that they’re doing it all: designing the study, recruiting participants, running sessions, taking notes, analyzing the data, and reporting.
I’ve learned a lot from the people I’ve worked with on studies. Two of these lessons are key:
– Doing note taking well is really hard.
– There are ways to make it easier, more efficient, and less stressful.
Today, I’m going to talk about a couple of the techniques I’ve learned over the years (yes, I’ll give credit to those I, um, borrowed from so you can go to the sources) for dealing with stuck participants, sticking to the data you want to report on, and making it easy to see patterns.
Graduated prompting
Say you’re testing a process that has several steps and you want to see the whole thing, end-to-end. This is not realistic. In real life, if someone gets stuck in a process, they’re going to quit and go elsewhere. But you have a test to do. So you have to give hints. Why not turn that into usable data? Track not only where in the user interface people get stuck, but also how much help they need to get unstuck.
This is also an excellent technique for scavenger hunt tasks – you can learn a lot about where the trigger words are not working or where there are too many distractions from the happy path or people are simply going to need more help from the UI.
Here’s what I learned from Tec-Ed about what to do when a participant is stuck but you need them to finish:
– First, ask participants to simply try again.
– If participants are unable to move forward, give a hint about where to look: “I noticed that you seem to be focused mostly in this area (pointing). What if you look elsewhere?”
– If participants are still stuck and want to give up or say they would call someone, let them call a “help desk” or, depending on the study, give a stronger hint without being specific.
– Finally, you may have to get specific.
The idea is to note where in the UI you’re giving the hints and how many for any particular hindrance. This gives you weighted evidence for any given participant and then some great input to design decisions as you look at the data across participants.
Pick lists
You may say this is cheating. But don’t you feel like you have a pretty good idea of what’s going to happen when a participant uses a design? This technique is about anticipating what’s going to happen without projecting to participants what the possibilities are. Make a list of all the possible wrong turns you can imagine. Or at least the ones you care about fixing.
Being able to do this comes from awareness and the researcher’s experience with lots of user interfaces. This is not easy to do if you’ve only done one or two studies. But as you get more observations under your belt, looking ahead gets easier. That is, most of us are paying attention to the happy path as the optimum success in a task, but then have to take lots of notes about any deviation from that path. If you look at what the success and error conditions are as you design a study, you can create list to check off to make data gathering quicker and less taxing as you’re doing both that and moderating.
Here’s an example from a study I did with Ginny Redish researching the language of instructions on ballots. This is on a touch screen, so “touch” is the interaction with the screen, not with an actual candidate:
There are a lot of things wrong with this particular example: having the same word at the beginning of many of the possible selections does not make the list easy to skim and scan; there are too many items in the list (we ended up not using all of those error conditions as data points). As we designed the test, we were interested in what voters did. But as we analyzed the data and reported, we realized that what didn’t matter for this test as much as whether they got it right the first time or made mistakes and recovered or made mistakes and never recovered. That would have been a different pick list.
But all was not lost. We still got what we wanted out of the pick lists. This is what they ended up looking like as note-taking devices:
Judged ratings
Usually in a formative or exploratory study, you can get your participants to tell you what you need to know. But sometimes you have to decide what happened from other evidence: how the participant behaved, what they did to solve a problem or move forward, where they pointed to.
As a researcher, as a moderator, you’re making decisions all the time. Is this data? Is it not? Am I going to want to remember this later, or is it not needed?
After we realized that we were just going to make a judgment anyway, Christine Perfetti and I came up with a shortcut for making those kinds of decisions. Really, what we’re doing is assisting judgments that experienced researchers have probably automatized. That is, after dozens or hundreds of observations, you’ve stored away a large library of memories of participant behaviors that act as evidence of particular types of problems.
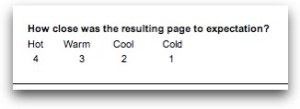
To make these on-the-fly judgments, Christine and I borrowed a bunch of techniques from Jared Spool at UIE and used variations of them for a study we worked on together. As the moderator of the day asked, “What do you expect to happen when you click on that?” and followed up with, “How close is this to what you expected?” the note taker for the day recorded something like this:
Another way to use this trick is to ask, “The task is [X]. How close do you feel you are now to getting to where you want to be? Warmer? Cooler?”
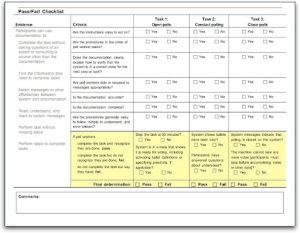
I also think that most of us collect too much data. Well, okay, I often do. Then I wonder what to do with it. I’ve found that when I really focus on the research questions, I can boil the data collecting down significantly. So here’s a minimalist note-taking device:  I created a one-sheet data collector that covered three tasks and helped me document a pass/fail decision for voting system documentation. You can quibble about some of the labeling in the example below, but I was happy to have one piece of paper that collected what happened along with how I know that, and what that combination of things happening means.
It attempts to encapsulate the observation-inference-theory process all in one place.
Again, if you haven’t done much user research or usability testing, you may not be happy with this approach. And, let’s not forget how valuable qualitative data like quotes is. But you more experienced people out there may find that codifying the judgments you’re making this way makes it much quicker to note what happened and what it might mean, expediting analysis.
Shortcuts are not for sissies
Most user research is not run in an ideal world. Note taking in user research is one of the most difficult skills to learn. Luckily, I have had great people to work with who shared their secrets for making that part of the research less stressful and more efficient.
Graduated prompting is a way to quantify the hints you give participants when you need them to complete tasks in a process or continue on a path in a scavenger hunt.
Judged ratings are based on observations and evidence that fall into defined success and error criteria.
Got several dozen hours under your research belt? Focus the data collecting. Try these techniques for dealing with stuck participants, sticking to the data you want to report on, and making it easy to see patterns.
:: :: :: :: :: :: :: :: NEWS FLASH :: :: :: :: :: :: :: ::Come to UI 14 in Boston November 1-3 and get a discount on me. Type in promotional code CHISNELL when you register and you’ll get $50 off each day. If you sign up for all three days, you’ll also get a set of Bose headphones. Sweeeet.


Do it! You know you want to. Mastering the Art of User Research.

As I have said before, taking notes is rife with danger. It’s so tempting to just write down everything that happens. But you probably can’t deal with all that data. First, it’s just too much. Second, it’s not organized. Let’s go back to the example from the last post. The research question was Do people make more errors on one version of the system than the other? And we chose these measures to find out the answer:

    • Count of all incorrect selections (errors)
  • Count and location of incorrect menu choices
  • Count and location of incorrect buttons selected
  • Count of errors of omission
  • Count and location of visits to online help
  • Number and percentage of tasks completed incorrectly

Here’s what I did. First, I listed the page (sometimes I put in a screen shot), with the correct action and then the possible (predicable, known) errors, like this:

I hope you can see how to turn this into a pick list. You can just check these items off or number them if people do more than one of the errors. For my note taking forms, I added a choice for “Other” in case something happened that I hadn’t anticipated. This is from a different study, but you get the idea: This is what your notes end up looking like. Even if you’re not doing statistical analyses, it’s easy to hold up these pages together across participants to see how many had problems and how severe the problems were.

A common mistake newbies make when they’re conducting their first usability tests is taking verbatim notes.

Note taking for summative tests can be pretty straightforward. For those you should have benchmark data that you’re comparing against or at least clear success criteria. In that case, data collecting could (and probably should) be done mostly by the recording software (such as Morae). But for formative or exploratory tests, note taking can be more complex.

Why is it so tempting to write down everything?
Interesting things keep happening! Just last week I was the note taker for a summative test in which I noticed (after about 30 sessions), that women and men seemed to be holding the stylus for marking what we were testing differently and that it seemed that difference was causing a specific category of errors.

But the test wasn’t about using the hardware. This issue wasn’t something we had listed in our test plan as a measure. It was interesting, but not something we could investigate for this test. We will include it as an incidental observation in the report as something to research later.

Note-taking don’ts

  • Don’t take notes yourself if you are moderating the session if you can help it.
  • Don’t take verbatim notes. Ever. If you want that, record the sessions and get transcripts. (Or do what Steve Krug does, and listen to the recordings and re-dictate them into a speech recognition application.)
  • Don’t take notes on anything that doesn’t line up with your research questions.
  • Don’t take notes on anything that you aren’t going to report on (either because you don’t have time or it isn’t in the scope of the test).

Tips and tricks

  • DO get observers to take notes. This is, in part, what observers are for. Give them specific things to look for. Some usability specialists like to get observer notes on large sticky notes, which is handy for the debriefing sessions.
  • DO create pick lists, use screen shots, or draw trails. For example, for one study, I was trying to track a path through a web site to see if the IA worked. I printed out the first 3 levels of IA in nested lists in 2 columns so it fit on one page of a legal sized sheet of paper. Then I used colored highlighters to draw arrows from one topic label to the next as the participant moved through the site, numbering as I went. It was reasonably easy to transfer this data to Excel spreadsheets later to do further analysis.
  • DO get participants to take notes for you. If the session is very formative, get the participants to mark up wireframes, screen flows, or other paper widgets to show where they had issues. For example, you might want to find out if a flow of screens matches the process a user typically follows. Start the session asking the participant to draw a boxes-and-arrows diagram of their process. At the end of the session, ask the participant to revise the diagram to a) get any refinements they may have forgotten, b) see gaps between their process and how the application works, or c) some variation or combination of a and b.
  • DO think backward from the report. If you have written a test plan, you should be able to use that as a basis for the final report. What are you going to report on? (Hint: the answers to your research questions, using the measures you said you were going to collect.)